Digital Postcards Drive 87% Engagement for First-Time Users, Reinforcing the Power of Multimedia and Mobile-Friendly Benefits Communication
BOSTON – October 1, 2024
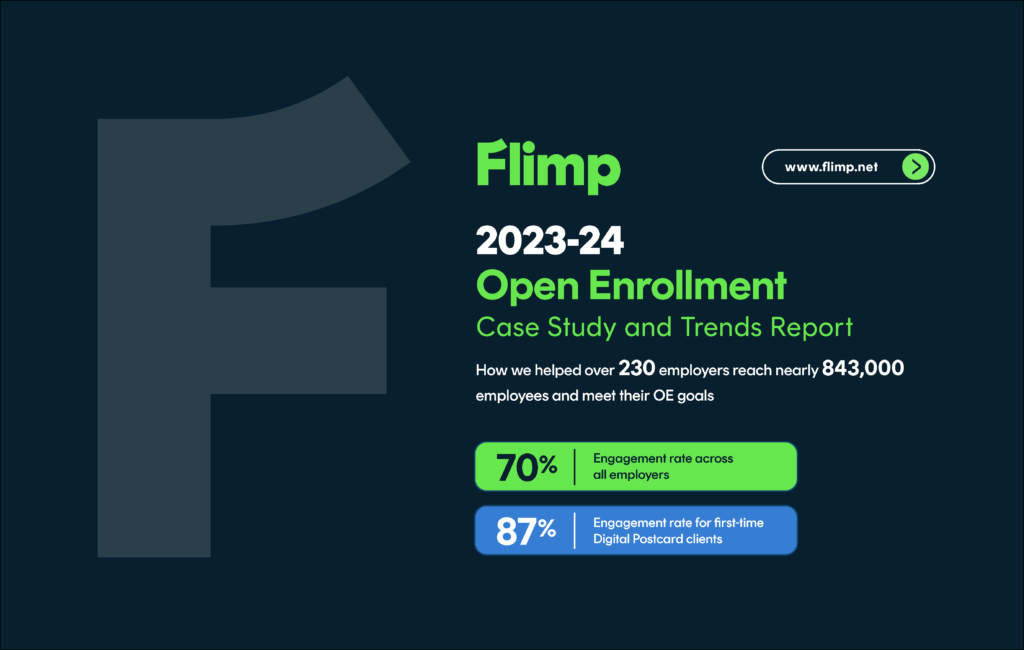
Flimp, a leading provider of employee benefits communications and decision-support tools, today announced the results of its 2023-24 Open Enrollment Case Study and Trends Report. The report shows an average engagement rate of 70% across campaigns from 235 employers in 14 industries and 842,000 employees. First-time users of Flimp’s Digital Postcards saw an even higher engagement rate of 87%, demonstrating the appetite for multimedia and mobile-friendly benefits communications.
Flimp’s Digital Postcards, which incorporate videos, benefits guides, and decision-support tools continued to prove their effectiveness in reaching remote, in-office, and field-based employees. Built and hosted on the Flimp Canvas platform, Digital Postcards were distributed via email, text, and QR codes that were included on posters and printed flyers to further boost engagement. As a result of this more robust, multichannel approach to benefits communication, mobile views of these campaigns climbed to 19% this year.
“Our clients’ exceptional engagement rates are what keeps our retention rates so high year after year,” said Wayne Wall, CEO of Flimp. “Clients love that we can help them create, distribute, and track performance of their benefits communications to ensure employees are educated, engaged, and empowered to make the right benefits decisions.”
2023-24 Open Enrollment Engagement Highlights:
- Average engagement rate: 70%
- First-time Digital Postcard users: 87%
- Average time on content: 1 minute
- Total campaigns: 255
- Total employees targeted: 842,747
- Total actions taken: 415,733 (includes video views)
- Mobile views: 19%
- Countdown clocks: used in over 37% of campaigns
- Video content: 1,106 videos used across 255 campaigns.
- QR code engagement: 70%, with mobile rates climbing to 29%*
* Note Flimp’s QR code tracking references campaigns for Flimp-created QR codes and not those created by clients.
Engagement Rates by Industry:
- Construction: 117%
- Banking and financial services: 90%
- Consumer products and retail: 89%
- Information technology: 88%
- Pharmaceuticals and biotechnology: 85%**
- Comms/telecoms, media, and broadcasting: 82%
- Healthcare: 70%
- Transportation (planes, trains, automobiles): 70%**
- Insurance, legal, and business services: 61%**
- Education: 63%
- Government and municipalities: 53%
- Oil, energy, and utilities: 52%
- Manufacturing: 51%
- Recreation, hospitality, and tourism: 43%
Note: There were other industries included in aggregate data that were not called out in industry-specific breakdowns due to limited sample size.
** New addition to report this year
Some of the prominent brands analyzed in this year’s report include: AMC Theatres, New Balance, NPR, Swire Coca-Cola, and Tripadvisor. Further details of campaign performance segmented by industry vertical can be found in the full report, available to view and download here: 2023-24 Open Enrollment Case Study and Trends Report.
For more information or to schedule a consultation, visit www.flimp.net/contact.
About Flimp
Flimp is a premier provider of employee benefits communications, educational content, texting, and decision-support tools for employers, consultants, enrollers, and insurance carriers. Flimp Campaigns offers customized benefits content combined with white-glove managed services to clients to ensure their benefits communication programs are a success. The company’s technology platforms — Flimp Canvas (content creation, distribution, and tracking), Flimp Connect (messaging) and Flimp Decisions (decision support and plan analytics) — offer everything needed to engage, educate, and empower employees to make better, more informed benefits decisions. Flimp serves more than 1,300 corporate clients across nearly every industry, including dozens of Fortune 500 companies, and partners of all sizes, including the top 10 brokers in the United States. For more information, please visit www.flimp.net.
Media Contact:
Heather Bliss
for Flimp Communications
press@flimp.net
P: 888.612.3881
