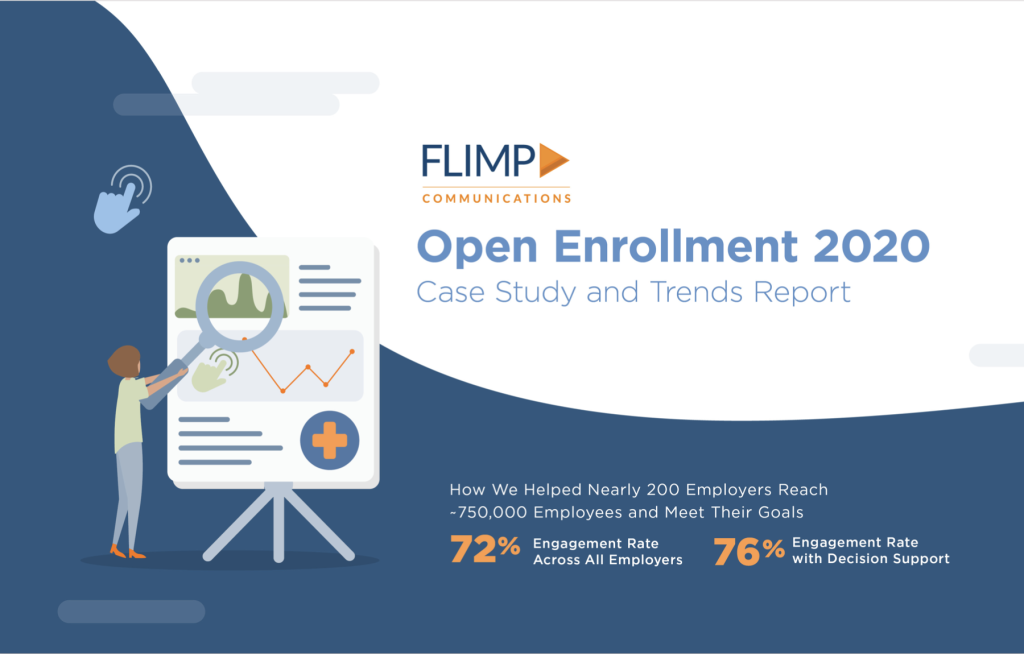
Aggregate results from nearly 200 campaigns show views on mobile devices increased by 14 percent, QR code requests more than doubled, and campaigns featuring decision-support tools drove 76 percent engagement
Flimp Communications, a leading developer of digital employee communication and engagement solutions, today announced the results of the Open Enrollment 2020 Case Study and Trends Report. With benefits fairs and in-office benefit-orientation meetings canceled, HR leaders and brokers turned to Flimp Communications for self-guided solutions like decision-support tools, videos, Virtual Benefits Showcases and Digital Postcards to educate employees on benefits options. For the 2021 benefits open enrollment period*, Flimp analyzed results from nearly 200 annual benefits-enrollment campaigns that were served up to nearly 750,000 employees and realized near-record-high average engagement rates of 72 percent. Campaigns that leveraged decision-support tools saw engagement rise to 76 percent. Several industries realized impressive higher-than-average engagement this year with Construction leading the charge at 91 percent.
Benefits open enrollment report highlights at a glance:
- Average Engagement Rate: 72%
- Average Time on Content: 3 minutes 17 seconds
- Campaigns: 196
- Total Targeted Employees: 749,213
- Total Actions Taken (includes video views): 689,345
- Average Response Rate: 1.86 actions per view
- Average Mobile Views: 16%
“Creating compelling employee communications for virtual open enrollment during a pandemic proved to be critical for most employers,” said Wayne Wall, CEO and founder of Flimp Communications. “Implementing on-demand solutions like Digital Postcards, mobile-responsive portals, benefits explainer videos, and decision-support tools with multi-channel distribution options and activity tracking helped our clients achieve near-record-high open enrollment engagement results. We’re incredibly proud to serve HR leaders that pivoted their strategies to include more digital communications in their OE campaigns and look forward to helping our clients with a successful open enrollment again this year.”
Notable trends in open enrollment communications last year include:
- Campaigns featuring a decision-support tool showed a higher-than-average engagement rate at 76%
- QR code requests more than doubled from the 2019 enrollment period to 2020 and were included as a touchpoint in more than 10 percent of all OE campaigns
- Digital Postcard views via mobile devices rose from 14% in 2019 to 16% in 2020, a 14% overall increase
Employee engagement rates by industry:
- Construction: 91%
- Manufacturing: 66%
- Consumer Products and Retail: 61%
- Information Technology: 61%
- Healthcare: 54%
- Other: 80%
Key Takeaways from the Open Enrollment 2020 Case Study and Trends Report
As HR professionals and benefits brokers look to improve employee engagement during the coming open enrollment period, we offer these key takeaways from the report for your consideration.
- Consider decision-support tools: More campaigns included decision support than ever before. Campaigns featuring these tools showed a higher-than-average engagement rate (76% vs the 72% aggregate average).
- Push messages frequently: The best campaign results were those that regularly pushed benefits and enrollment information to employees via internal email or texting. Key information, like enrollment deadlines and how to access the enrollment portal, was consistent across all versions of the message.
- Personalize messages: Customization of employee benefits has become part of improving the employee experience. Digital enrollment campaigns were particularly effective, as they could be adjusted and customized for a variety of audiences in multiple languages across a dispersed workforce.
- Compelling visuals and more content: Compelling visuals and more frequent distribution of content was another overarching theme. The increase in voluntary benefit offerings combined with the need to transition to digital solutions during the pandemic meant an expanded communications effort and an emphasis on self-guided education.
- Mobile friendly: One of the trends we saw employers use to cope with the pandemic and disparate workforces was QR codes to tie printed materials (like breakroom posters or mailers) to Digital Postcard campaigns. QR code requests more than doubled from 2019 to 2020.**
- Active enrollment prevails: Campaigns that specified it was an active-enrollment period saw an engagement rate almost 30% higher than those that were explicitly passive or where active/passive wasn’t specified at all (92% compared to 63%).
Some of the world’s most recognized brands leveraged Flimp Communications’ solutions for open enrollment in 2020 including American Diabetes Association, Georgetown University, Ken’s Foods, Jostens, NPR, and Stamps.com.
Download Flimp Communications’ Open Enrollment 2020 Case Study and Trends Report here: https://www.flimp.net/open-enrollment-case-study-and-trends/
For more information or to sign up for a guided demo of our open enrollment communications solutions, visit: https://www.flimp.net/contact.
About Flimp Communications
Flimp Communications is a leader in HR, benefits and employee communication and provides virtual communications solutions including software, decision-support tools, workforce texting and interactive digital content to employers, HR consultants, insurance carriers, and healthcare providers. With offices in Boston, MA, Denver, CO, Vero Beach, FL, and Burlington, VT, Flimp works with over 700 corporate clients, including many Fortune 500 companies. The award-winning employee-communications platform enables users to create, distribute and track interactive video and branded multimedia content without any programming or IT resources for corporate, internal and employee communications. For more information, please visit www.flimp.net.
* Annual benefits enrollment 2020 calendar year
** Note Flimp’s QR code tracking references campaigns for Flimp-created QR codes and not those created by clients.

